Whether you use it in-camera or in your post-processing software, you ultimately will come across a set of mountains that help to describe the pixel distribution by the brightness of your image. This mountainous graphic is known as a histogram.
What the “mountains” mean
Histograms in Lightroom and Adobe’s Camera Raw are broken up into five main sections — blacks, shadows, exposure, highlights, and whites. Some cameras and image editing programs divide it a little differently — shadows, mid-tones, and highlights, or blacks, quarter tones, mid-tones, and highlights. There is no standard for these divisions and the idea is the same.

As you adjust your camera’s settings, these “mountains” change height and width, as well as placement. Depending on which section your mountain is in if it is higher, there are more pixels — lower or a flat line means less or no pixels at all.
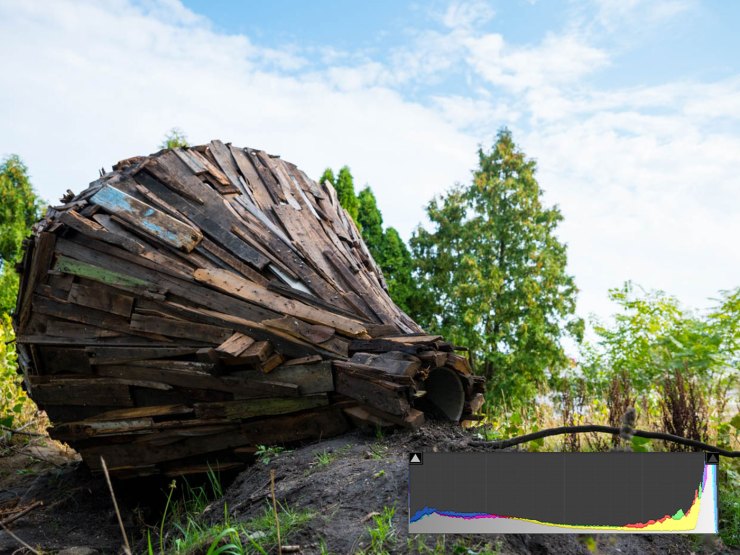
A large mountain on the right side of the histogram, suggests that the image might be over-exposed. In this case, details in the brighter parts of the photograph, the clouds, are missing.

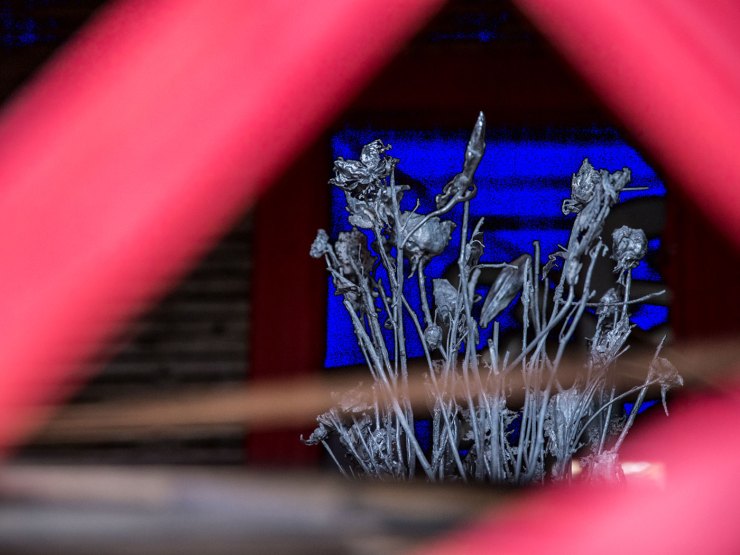
If the histogram has a large mountain on its left side, the shadows in the image might be too dark to show detail. Photographs made in a theatre or at a concert, are another couple of examples.
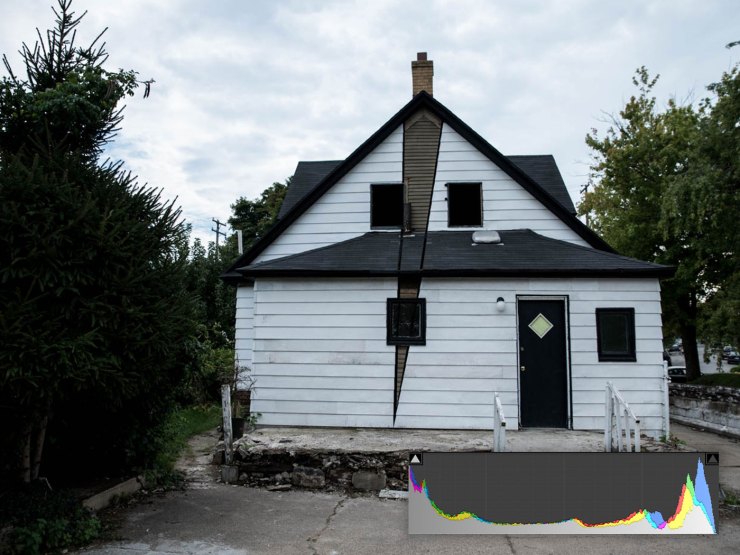
If there are high mountains on both sides of the histogram, creating a sort of U-shape, the image most likely has a lot of contrast.
What about post-processing?
 Whether you use a program like Lightroom, Photoshop or Luminar, you can adjust things like black levels, white levels, highlights and shadows for a more evenly toned photograph.
Here’s a trick — in Lightroom, hold down the Shift key and double click on Whites. Do the same for Blacks. The sliders will adjust automatically, increasing the tonal range of your photograph as much as it can. Using this technique on your images will help you lift the shadows and take down the over-highlighted areas of your photograph. This is the first thing I do for every photograph, as it allows me to see the most amount of detail that I can.
You can also adjust the highlights and shadows sliders further, allowing you to take down a harsh sky or brighten up a dark part of a room.
One great tool as part of the histogram is the ability to see clipping levels. This shows you areas that are either too dark or too bright. To turn this on, click the triangle in the upper left or right part of the histogram. Clicking on the left triangle will show you dark areas, whereas clicking on the right triangle will show you bright areas. If either triangle is dark grey, there is no clipping present.
Colored parts of the histogram
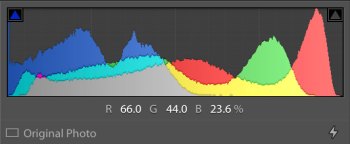 When editing a color photograph, you’ll notice your histogram will have red, green, blue and other colors to it. The other colors like cyan and magenta come from when the red, green and blue colors overlap.
This part of the histogram tells you the proportion of red, green and blue colors in your image. As you move your cursor over your image, you’ll see the proportion values change under the histogram.
Ultimately, even if your photo might not be perfect in-camera, tools like Lightroom can help you take it to the next level, furthering the goal of making for a more evenly toned image.
There’s no such thing as a bad histogram — a histogram only displays the photographer’s intent.
Tell your story with the second annual Visual Storytelling Conference!
Experience four days of interactive, online training sessions featuring a range of educational content with experienced photographers and content creators. This free event kicks off with a series of technical boot camps to build essential skills, followed by live, online sessions on photography, video, business and social media. Join live from March 10-13, 2022!
